Continue with onX Maps
 Sign in with Facebook


Max/Average Grade of Ticks for Crag by Climber: Example the Gunks


|
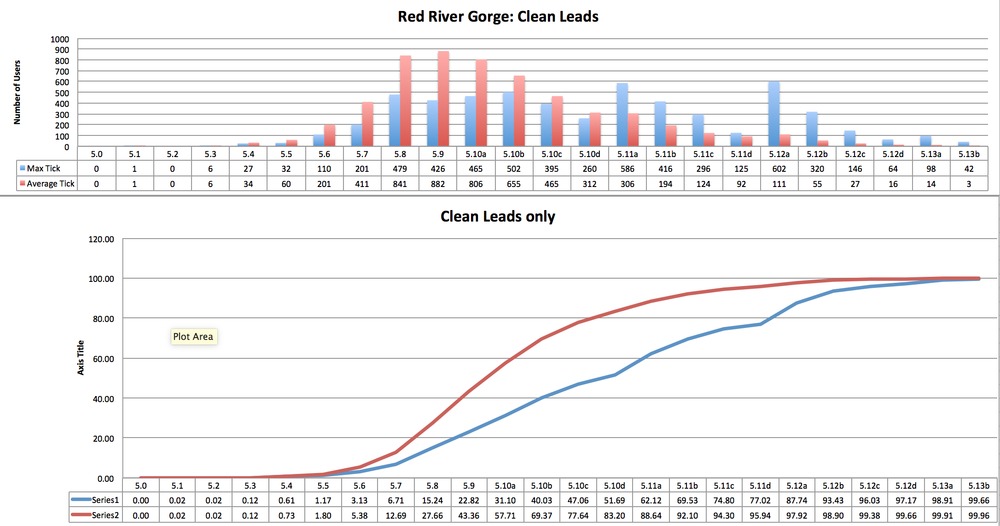
Kalli Schumacher wrote: Here's what the Red looks like (I know this isn't a direct comparison, mixed sport/trad vs trad areas, but it was the next place I was interested in). Interesting! I admit I have been curious about this sort of thing, but not so curious that I wanted to do the work, LOL. However, I think any comparison between areas, e.g. Gunks vs Red, would be very flowed without having an underliying info about what's available at the area. And sport/trad is only a small part of it. if you just say Gunks -- trad, Red -- sport, Gunks has a LOT of routes 5.9 and under. Red has hardly any, relatively speaking... So people who want/need to climb sport routes that are 5.9 or less just wouldn't be able to tick all that many routes at the Red, while they would be able to tick a lot. Similarly, the "5.12 effect" that was mentioned above, while real, appears to be a lot bigger at the Red, until you take into account that there are more 5.12a routes available at the Red, compared to 5.12b/c/d, or 11d, or 11c, or 11b, or 11a, etc. 5.12a is simply happens to be the highest-frequency available grade at the Red... so it makes sense that there would be more ticks for that grade than surrounding grades, and the "5,12a effect" is, in fact, a lot more blunted if you take the availability into account. I graphed the total number of sport routes at the Red by the grade, to explain what I am talking about. This was taken from the Redriverclimbing.com, becuase their database is way more complete than MP. 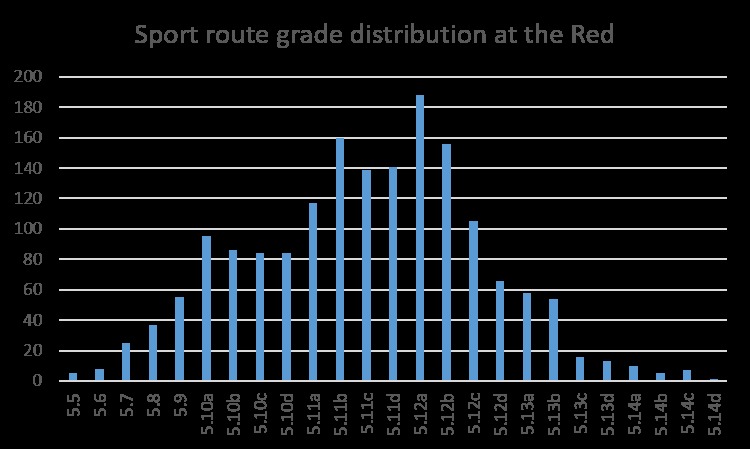 |

|
Lena chita wrote: Interesting! I had just assumed that the grade distribution at the Red was fairly uniform. But that's what you get for assuming.... (and how many of those 12as should really be 11ds....) I will note, though, looking at the graphs for the Bow Valley, Squamish, and Smith, that the 11a and 12a effects seem to be repeating themselves. Can't wait to see more areas (Tensleep? Indian creek? NRG?) to really reach some conclusions.One more thought. I doubt the MP database is deep enough to draw any conclusions about areas that use Euro or ZA or Australian grades. But if it, were, I wonder if there's a 7a effect in Europe? And if there's no similar effect for the ZA/Aus grades, because they're just a linear progression? |
|
|
Nkane 1 wrote:I’m sure if you extract the data for people who only ticked one 12a at the Red, you will find the same dozen or so routes repeatedly: Ro Shampo, Hippocrite, Starry Night, Burliers Bane, Snozzberries, Check Your Grip would be my guesses. ;) I will note, though, looking at the graphs for the Bow Valley, Squamish, and Smith, that the 11a and 12a effects seem to be repeating themselves. Can't wait to see more areas (Tensleep? Indian creek? NRG?) to really reach some conclusions.I have no doubt that 12a effect is real, and reproducible across all sport climbing areas! My point was just that the effect looks bigger, because we aren’t taking the availability of routes into account, and normalizing to it.
I think there would be a 7a, and 8a effect in Europe, but MP is woefully incomplete for areas outside the US. You’d have to pull it off UK climbing, maybe? Or look on 8a.nu for the 8a effect. I’m guessing it would be very pronounced on that site. ;) Aussies I would predict to have a slight bump at 20 (mid11) and another one at 30 (8a) |
|
|
Ok quickly ran the grade distributions for each area.  |
|
|
Kalli Schumacher wrote: Ok quickly ran the grade distributions for each area. This is grade distribution of routes in MP database, at each location, and I’m assuming not divided by sport/trad? I think there is a very strong bias introduced by the fact that the routes are entered by users, and users enter the routes they climb... and since the majority of climber population overall doesn’t climb 5.12, you get nearly all 5.9s from the Ted in the MP database, but a lot of 5.12s at the Red are missing from MP... |
|
|
What Marc 801C said. |
|
|
Kalli Schumacher wrote: Ok quickly ran the grade distributions for each area. This may be more compelling if the data points were percentages of the total area population that max at each grade. Right now, it is hard to spot much except that a lot of people climb at the red. |
|
|
phylp wrote: What Marc 801C said. Are we piling on and accusing someone of bad stats who was literally just making some cool charts based on MP data for MP users who have too much time on their hands while sitting at work? If so, let me go grab my witch hunting costume and a couple flaming torches to get the party started, or, you know, we could just take an interesting spade as an interesting spade... Also, Randy, read the axis titles or grab a dunce cap. |
|
|
Luka Bogdanovic wrote:I feel like MP users who track ticks are going to skew to stronger climbers where your average 5.6 - 5.9 casual climber won't even know what MP is. Sorry it's the opposite. MP skews to gumbies, strong people record ticks on 8a.nu |
|
|
Randy Von Zee wrote: I agree that percentages would be good. But my understanding is that this particular graph is for total number of routes at each grade, in each location, not total number of ticks. |
|
|
phylp wrote: What Marc 801C said. You can’t analyze the data that isn’t there... This is just a fun exercise for people who like numbers. Not a rigorous scientific study. |
|
|
John Clark wrote: I thought there was a normal discourse on data analysis going, but perhaps my perceptions are skewed - I am used to having open discussions at work. As a matter of fact, it is that makes projects at my work place successful - exchange of ideas and not taking analytic approach towards possible shortcoming as a form of personal insult. |
|
|
So for those of us that are not looking too deeply, what are your conclusions? |
|
|
The Gunks chart conforms with my anecdotal impressions of how people climb in the Gunks. |
|
|
amarius wrote: See but pointing out all the flaws in MP data isn’t helpful as I can’t change that. Now if y’all want to tell me ideas on how to cross compare areas or visualize the data I’ve already pulled, I’m all ears.Initial thoughts by myself and friends were: Given two areas, eliminate any local climbers (a climber therefore more likely to be climbing harder at their home crag) and then find the subset of people who have ticked a route (or at least x routes) at each area. Plot their max/avg grades at each crag as a scatter plot. |
|
|
Marc801 C Nailed it The new climbers who are all excited and stoked are the ones eagerly ticking every route they do on MP whereas the more experienced, stronger climbers don't particularly care about ticking their routes on social media (though they likely keep track on their own). Hence we see lots of 5.6-5.9 ticks and significantly fewer above 10d. |
|
|
Kalli Schumacher wrote: Ok quickly ran the grade distributions for each area. can you normalize each distribution so it's easier to compare different areas? |
|
|
Lena chita wrote: I noticed that your graph from redriverclimbing only has about 60 5.9 climbs, but the MP database has over 170. It sounds like redriverclimbing skews towards the harder climbs and mp skews towards the easy climbs? We would have to cross-reference the two lists to create the "ultimate" list and the graph it. At first glance, it looks like both graphs of total grade distribution are currently skewed. |
|
|
Dylan Pike wrote: redriverclimbing lists 82 sport routes with grades 5.9-, 5.9,5.9+. A search for any 5.9-,5.9,5.9+ route - trad, sport, mixed, or tr - on redriverclimbing yields 305 listings. |
|
|
amarius wrote: Good call. I was just going off Lena's graph. |