
 Continue with onX Maps
 Continue with Facebook


Median vs. mean consensus grades
|
|
Consensus grades on the site are currently calculated using the mean opinion. Switching to the median opinion would make the estimate more robust to outliers, and would prevent this sort of nonsense: |

|
I deleted the bogus ratings, and the route comments related to them. |
|
|
If the sample size is large enough and its normally distributed then the mean and median should be the same. With that said, I'm not sure what the sample size is... |
|
|
alexdavis wrote:If the sample size is large enough and its normally distributed then the mean and median should be the same. With that said, I'm not sure what the sample size is...beat me to it. except there is nothing normal about the distribution on MP! |
|
|
i agree that the median is the way to go. |
|
|
Young Gun wrote: Switching to the median opinion would make the estimate more robust to outliers, and would prevent this sort of nonsense: mountainproject.com/v/debbi… (Administrator decides he doesn't like a 5.11a climb so he gives it a 5.0 rating and screws up the consensus grade.)agreed. |
|
|
Is the mean still used? I can't figure it out. |

|
https://www.mountainproject.com/forum/topic/109084255/changes-to-route-consensus-ratings |
|
|
I believe it's median, but the page author's rating counts 3 times (or something). |
|
|
I'm happier with median because it actually represents a real opinion (not the calculated "2.6 children per family"). Different people have different styles and body types which may make the climb feel different to each person giving the rating. That said, I don't think it should matter much because the ratings should be in close proximity anyway. If someone rates a 5.5 as a 5.14 to skew (screw) the rating, they are an @$$hat and the data should be dumped. |
|
|
Here is how route grade voting is done on https://www.redriverclimbing.com/RRCGuide/?type=route&id=39 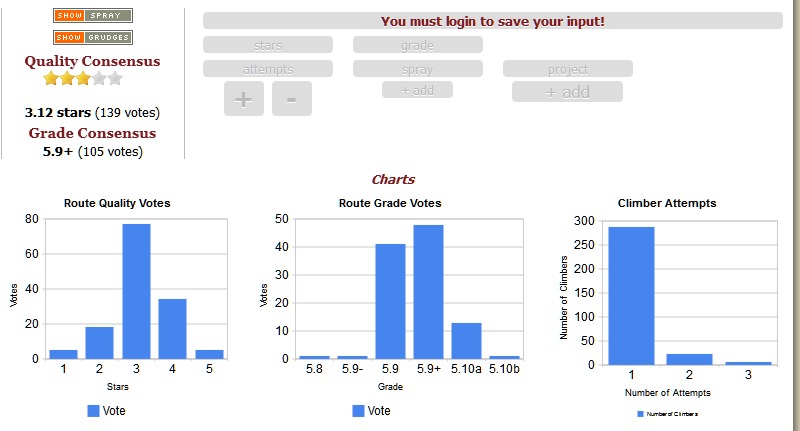 |
|
|
I prefer the way RedRiverClimbing shows the distribution using the charts and uses the consensus grade (median) |
|
|
Cole T wrote: Yes the charts are nice, but median consensus grade? Doesn't seem to be working for these: https://www.redriverclimbing.com/RRCGuide/?type=route&id=1066 https://www.redriverclimbing.com/RRCGuide/?type=route&id=2226 |
|
|
reboot wrote: Disclaimer - this is wank on, wank off data manipulation Difficult to say when sampling sizes are that small. If I fire Matlab, and use convention 13.25 = 13a, etc, "Southern Smoke" is |
|
|
amarius wrote: I'm nit-picking here, but I think you need to review your number conventions... dont you mean 13a would be 13.0? If an a is 13.25, and a d is 13.75, what are b and c? Edit to add: I used a convention of a=.0, b=.25, c=.5, and d=.75 Numbers round to the nearest .25, so ratings are plus or minus .125. (13a would be any number between 12.875 and 13.125, for instance.) Doing so, the mean for God's own stone is 13.8, or 13d. The median is 13.75, also 13d. For southern smoke, the mean is 14.1875, or 14b. The median is 14.125, which also rounds up to 14b. For both of these routes, of course, there are no extreme outliers, which the median would help guard against. |
|
|
Andrew Krajnik wrote: Your nitpicking and comments regarding my brainfarting are right on the money. |
|
|
agd wrote: If the sample size is large enough and its normally distributed then the mean and median should be the same. With that said, I'm not sure what the sample size is... That's only true if the data is valid and reliable. In the case of someone frivolously rating a 5.11a climb 5.0 for the purpose of messing up the page, that data point is not valid. |
|
|
The statistical theory analysis of robustness of median versus mean assumes that the data points are independent of each other. But with real humans in a public social setting, the assessments of route difficulty are surely not independent. There is substantial "herding" of opinions to follow what other people think (or what a favorite guidebook once said). Also social bias/skewing in that nobody wants to admit they felt they found the route _harder_ than what other people already said. Then there are rare cases of deliberate anti-herd contrarian game-playing. But as Nick just demonstrated, there are other ways to deal with those. Ken |
|
|
Eric L wrote: Technically that's only true if there's an odd number of data points. If there are four families, with 1, 2, 3, and 4 children, the median is 2.5 children per family. |


