Mountain Project Logo

bmi and onsight survey

Doug Hemken · · Madison, WI · Joined Oct 2004 · Points: 13,678
MorganH wrote: An R2 value of less than 0.2 is pretty poor.
Thinking about it, I realize that if any single variable had a partial R^2 of more than 0.2, climbing would be much less interesting to me.
Dan Flynn · · Northeast mostly · Joined May 2009 · Points: 5,065

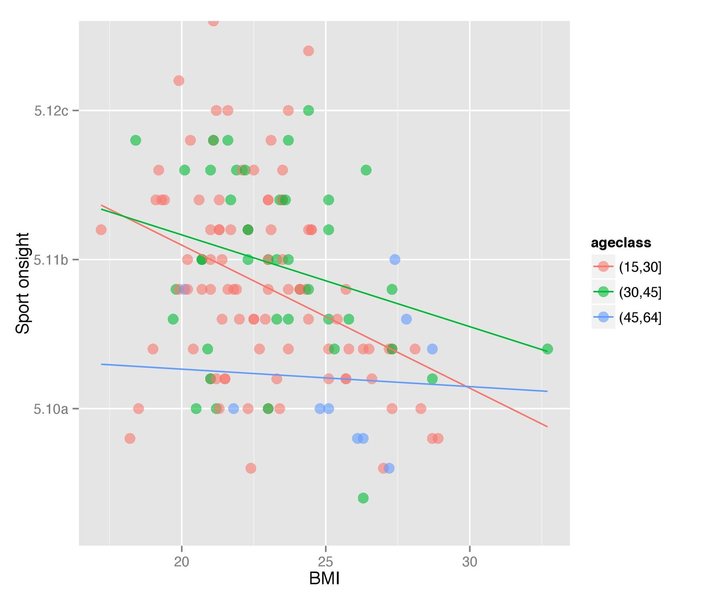
Fun times procrastinating. I looked at two things: effects of height and weight separate from BMI, and age as an extremely rough approximate for experience (and even rougher for total lifetime time spent training, obviously not current hours/week training). A few of the models below. Weight (the thing we can control) is always more important than height.

For trad climbing, every extra 10 lb = 0.6 of a grade less, every extra inch ~ 1/4 of a grade more. 30-44 year olds onsight nearly 2 grades harder than young'uns, 45+ a grade lower than the youths.
The effect of BMI tends to be weaker for older dudes (not a significant interaction though).

Trad onsight by BMI and age

df MS F p
gender 1 61.5 7.9 0.006 **
age 2 48.5 6.2 0.003 **
height 1 18.6 2.4 0.125
gen:lbs 1 121.5 15.6 0.000 ***
age:lbs 1 1.3 0.2 0.689
hei:lbs 2 10.8 1.4 0.255
Resid 1 8.6 1.1 0.295
Residuals 126 7.8

For sport, every extra 10 lbs means 0.8 grade less, every inch taller means .37 grade more. 30-44 yo climb .67 grades harder than younguns (ns), 45-64 3 grades lower.
Effect of BMI significantly stronger for youths, weaker for older climbers, where actual hours of training and lifetime experience might be much more important.

Sport onsight by BMI and age

df MS F p
gender 1 58.2 6.9 0.010 **
age 2 53.2 6.3 0.002 **
height 1 19.1 2.3 0.135
lbs 1 189.8 22.5 0.000 ***
gen:lbs 1 0.4 0.0 0.826
age:lbs 2 1.6 0.2 0.829
hei:lbs 1 13.7 1.6 0.204
Resid 132 8.4

I can send the R code to any other huge nerds out there.

Doug Hemken · · Madison, WI · Joined Oct 2004 · Points: 13,678

You're right, I didn't check for a non-linear age response! Nice. I think I'd prefer to show it as a quadratic, because the boundaries are more fluid than simple categories implies, but ... there it is, either way. Using a quadratic allows you to estimate a peak age, around age 40 for trad and 35 for sport I think (this is with BMI).

A note on presentation, your graphs don't really go with your tables or your description, which might confuse some people.

You're a ggplot fan then, eh?

Dan Flynn · · Northeast mostly · Joined May 2009 · Points: 5,065

Quadratic definitely makes sense, just binned mainly for easier plotting of the interactions, also side benefit of testing for non-linear effects.

Tables differ from figures, yes! I wanted to show the BMI plots because that's the main interest on this thread... when I'm preparing this for the Journal of Internet Forums I'll clean it up.

(just an excuse to learn ggplot, it's what all the kids are using now..)

Last bit of neRdery, then I'm going climbing. Color density scales to number of respondents.

Sport Trad OS corr

Doug Hemken · · Madison, WI · Joined Oct 2004 · Points: 13,678

That suggests a whole new series of questions .... I think the difference in the shape of the marginal distributions, and the outliers especially, speak to the fundamental difference between trad and sport.

W L · · NEVADASTAN · Joined Mar 2010 · Points: 851

As a short, stocky data geek who trad climbs and likes to make excuses why I can't climb hard sport or boulder, I approve of this thread....very nice!

Doug Hemken · · Madison, WI · Joined Oct 2004 · Points: 13,678
Dan Flynn wrote:when I'm preparing this for the Journal of Internet Forums I'll clean it up.
JIF has a notoriously caustic "peer"-review process. But then you get published anyway, so no worries.
drew abney · · Athens, GA · Joined Aug 2008 · Points: 40

That's one sexy plot, Dan. How did you get the distributions on the x- and y-axes (assuming ggplot...)? Could you send me the script?

Rob Gordon · · Hollywood, CA · Joined Feb 2009 · Points: 115

Forget all the fancy charts and graphs. If my body fat % went down from 22 to say 13, I'd be onsighting some 9s and 10s.

Right now I'm lucky if I can pull a 7. 8s on a good day.

But it wouldn't hurt if I got a new car, some new clothes, and a new pad. Hot chicks really care about that stuff.

Dan Flynn · · Northeast mostly · Joined May 2009 · Points: 5,065

Those are density plots, just using plain old plotting functions. Recycled from an old project, the trick is to use layout(), density(), and the polygon()... yup, this is what counts as fun during the work day!

Guideline #1: Don't be a jerk.

Training Forum
Post a Reply to "bmi and onsight survey"

Log In to Reply
Welcome

Join the Community

Create your FREE account today!
Already have an account? Login to close this notice.

Get Started